QR Code Analytics: Track Every Scan in Real Time
See every QR scan as it happens, with real-time tracking, geographic heatmaps, device data, email alerts, CSV export, and a shareable dashboard that turns scans into decisions.
Printing a QR code is the easy part. The hard part is knowing whether anyone actually scanned it, where they were standing when they did, and what to change next. A static black-and-white square gives you none of that. A dynamic QR code from uqr.ai gives you all of it, updating live as people scan.
Analytics turn a printed code into a feedback loop. Every scan becomes a data point you can read, share, and act on, which means your next flyer, menu, or shelf tag is smarter than your last one. Here is how scan tracking works on uqr.ai, what each number is telling you, and what to do about it.
See activity the moment it happens
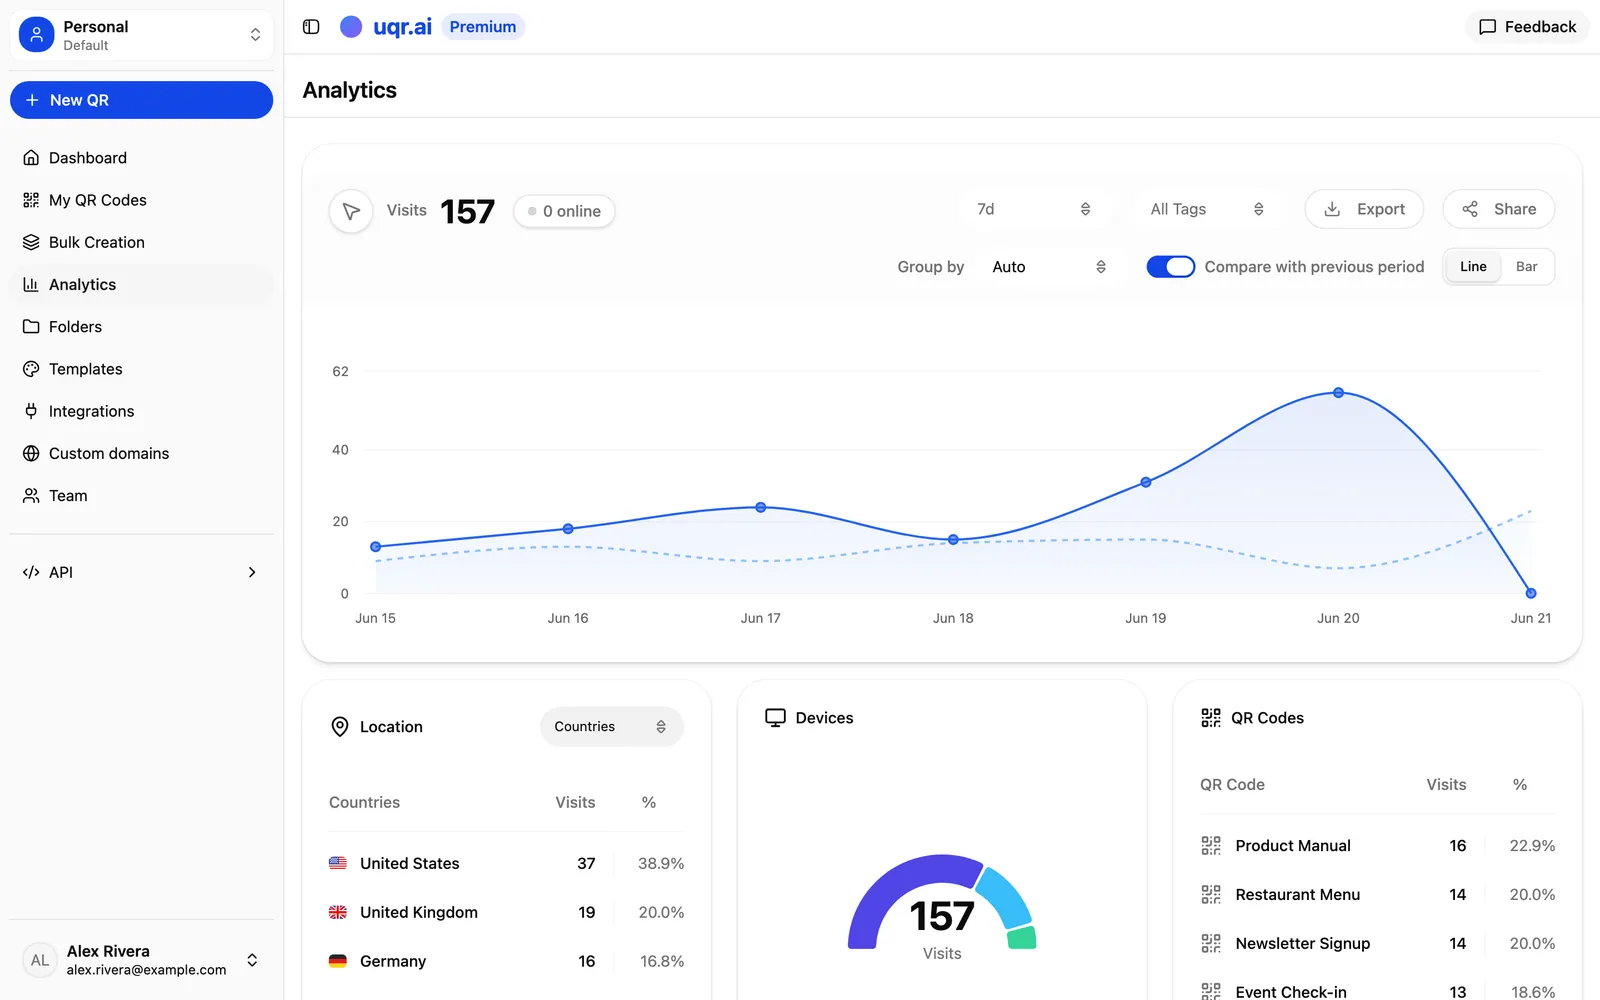
The instant someone points a phone at your code, the scan appears in your dashboard. There is no overnight batch job and no manual refresh ritual. Live updates matter most when timing is everything: a product launch, an event door opening, a TV spot airing, or a poster going up in a new location.
Watching scans arrive in real time lets you answer questions while you can still do something about them:
- Is the campaign live and working, or did something break between design and print?
- Which placement is pulling traffic right now, and which is silent?
- Did that email blast or in-store announcement actually move people to scan?
Because uqr.ai codes are dynamic, the loop closes immediately. If scans are flat, you can edit the destination URL behind the same printed code without reprinting anything, then watch whether the new landing page performs better.
Tip Flat scan numbers are not always a flop. Before you rewrite the campaign, check that the code points where you intended and that the landing page loads. Because the code is dynamic, fixing a broken link takes seconds and no reprint.
Who is scanning, and how
Two of the most actionable reports sit side by side: where your scans come from and what people scan with.
Geographic heatmaps
The geographic heatmap shows where scans are happening across the world. For a marketer, location is rarely a vanity metric. It tells you whether your reach matches your intent and where demand is showing up that you never targeted.
- Validate placement. If a regional campaign is generating scans from outside the region, your codes are traveling further than your print run, perhaps through photos shared online.
- Find unexpected demand. A cluster of scans from a city you never advertised in is a signal to test there next.
- Reallocate budget. Pour more into the locations that scan, and quietly retire the ones that do not.

Geographic data also pairs naturally with a Premium capability: country-based geolocation redirects. Once the heatmap shows you who is scanning from where, you can serve visitors in different countries different content from the same code, like a localized menu or a region-specific offer.
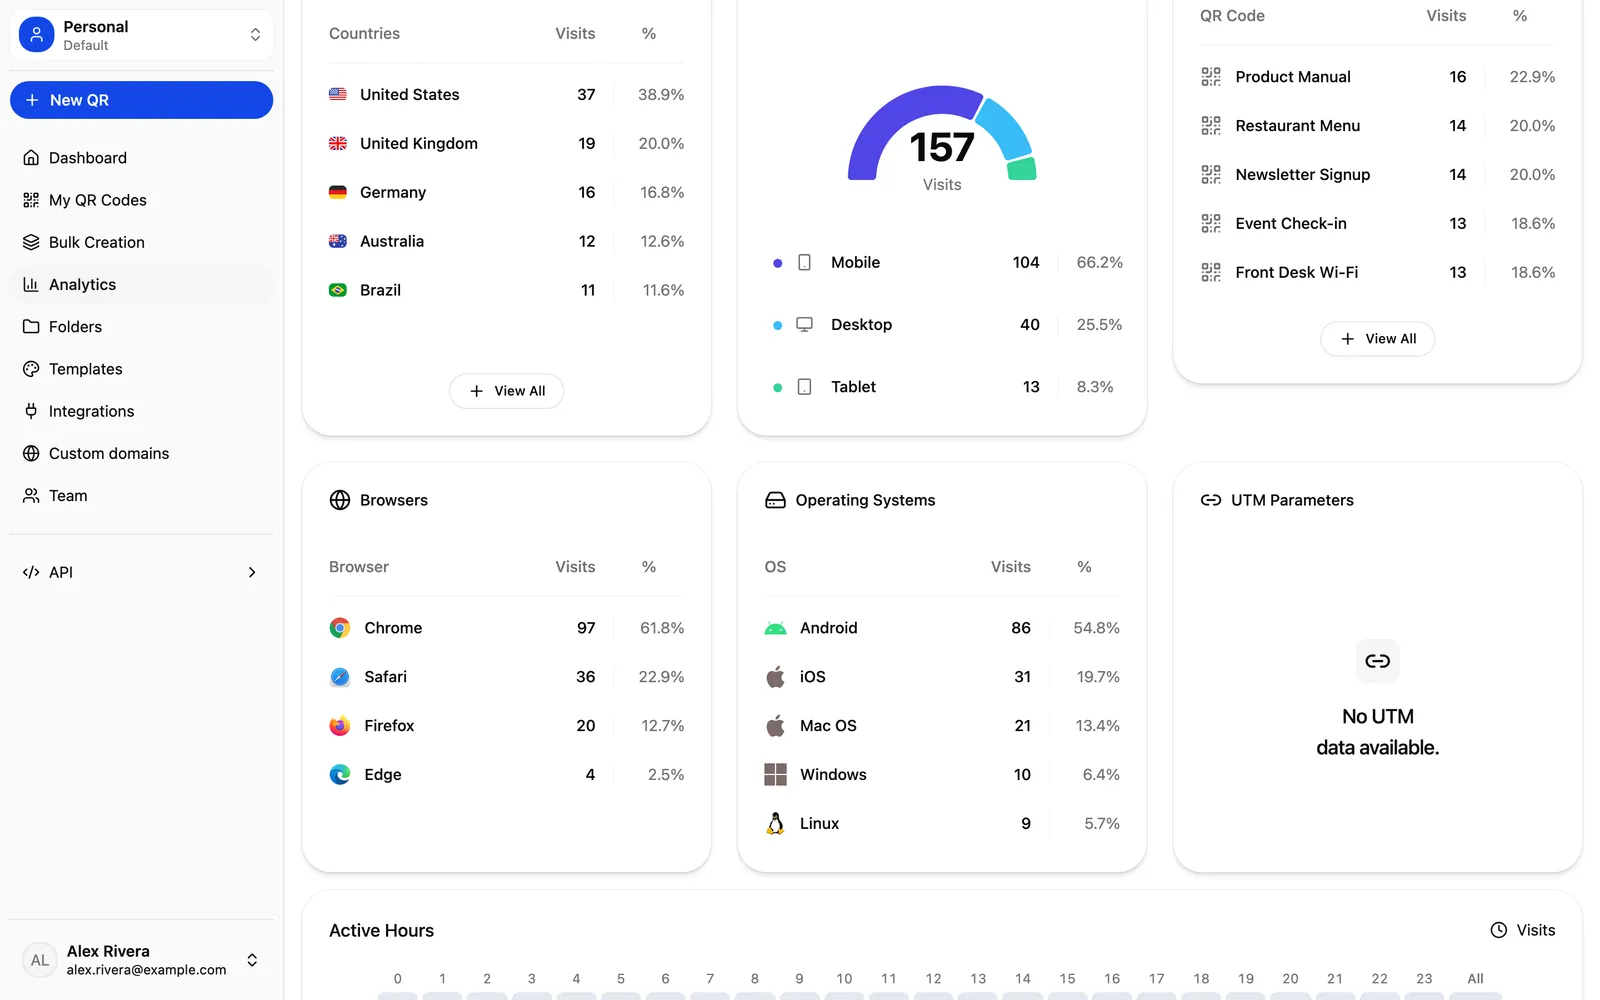
Device and browser breakdown
Device analytics show the devices and browsers your scanners are using. This is the metric that quietly protects your conversion rate, because a landing page that looks perfect on your laptop can fall apart on the phone where most scans actually happen.
- Mobile-first, for real. Scans come from phones, so confirm your destination page loads fast and reads well on a small screen.
- Match the platform. If one mobile platform dominates, prioritize testing your page and any deep links there first.
- Catch rendering issues. If a particular browser shows scans but your goal completions lag, that is a strong hint to test the page in that browser.
Bring scans into your workflow
Analytics are only useful when they reach the people who act on them. uqr.ai gives you two ways to push scan data out of the dashboard and into how you already work.
Email notification after each scan
Premium plans include an email notification after each scan. This is built for low-volume, high-value codes where every single scan deserves attention rather than for a billboard pulling thousands of hits. Think a vCard on a sales rep's badge, a code on a high-ticket proposal, or a private invitation. When it pings, someone real just engaged, and you can follow up while interest is fresh.
CSV export
CSV export hands you the raw scan data to slice however you like. Pull it into a spreadsheet to build your own charts, merge it with campaign costs to estimate cost per scan, or hand it to a colleague who lives in pivot tables. Export is also how you keep a permanent record of a campaign's performance for reporting after the fact.
Report without exporting
Sometimes the fastest way to report results is to let people see them live. uqr.ai lets you publish a shareable analytics dashboard at a public link, so a client, manager, or teammate can watch the numbers without a uqr.ai login and without waiting for your weekly export.
You stay in control of who sees what:
- Public link. Share one URL and anyone with it can view the live analytics for that code.
- Optional password protection. Add a password when the data is sensitive or client-confidential, so only the right people get in.
- Search-engine indexing control. Decide whether the dashboard can be indexed by search engines or kept out of public search results.
This turns reporting from a chore into a link. Drop it into a client update or a project channel once, and your stakeholders always see current numbers.
A restaurant menu code, week by week
Imagine a restaurant printing a single QR code on every table that opens its digital menu. Here is how the analytics earn their keep over a few weeks:
- Confirm it works. On opening night, real-time tracking shows scans climbing as tables fill. The code is live and the menu loads.
- Read the device data. Nearly all scans come from phones, so the team double-checks that the menu is quick and legible on mobile.
- Spot a pattern in the heatmap. A wave of scans from out-of-town visitors suggests tourists are a bigger audience than expected, worth a few non-local dishes highlighted at the top.
- Update without reprinting. When the seasonal menu changes, they edit the destination behind the same printed code. No new table tents, no waste.
- Share the results. The owner sends a password-protected dashboard link to a business partner instead of emailing screenshots every week.
Free versus Premium analytics
Every uqr.ai account gets analytics, and codes never expire no matter which plan you are on. The difference is depth and history.
| Capability | Free | Premium |
|---|---|---|
| Scan analytics | Basic | Advanced |
| Scan history | 3 months | 3 years |
| QR codes and scans | Unlimited | Unlimited |
| Email alert per scan | Not included | Included |
| Advanced controls | Not included | Password protection, link expiration, scan limits, country-based geolocation redirects |
Three months is plenty to validate a short campaign. Three years is what you want when QR codes are part of how your business runs and you need to look back across them.
Note Premium's three years of history is what lets you compare this season to last year, prove long-term trends, and keep a paper trail for campaigns that run for years.
Key takeaways
- Real-time tracking shows scans the moment they happen, so you can fix or double down while a campaign is still live.
- Geographic heatmaps and device breakdowns tell you where demand is and whether your landing page works on the phones doing the scanning.
- Email-per-scan alerts and CSV export push scan data into your inbox, your spreadsheets, and your reports.
- A shareable, optionally password-protected dashboard turns weekly reporting into a single link.
- Every plan includes analytics and unlimited scans; Premium adds advanced analytics, three years of history, per-scan alerts, and advanced controls.
Ready to see what your codes are doing? You can create a QR code for free in minutes, explore all features, or start a free 7-day trial of Premium to unlock three years of advanced analytics, per-scan email alerts, and the full dashboard.